Omnichannel Sales & Financial Revenue Performance Intelligence
High-impact Tableau sales intelligence dashboard tracking multi-channel revenue velocity, payment method distributions, and customer acquisition ROI.
Description
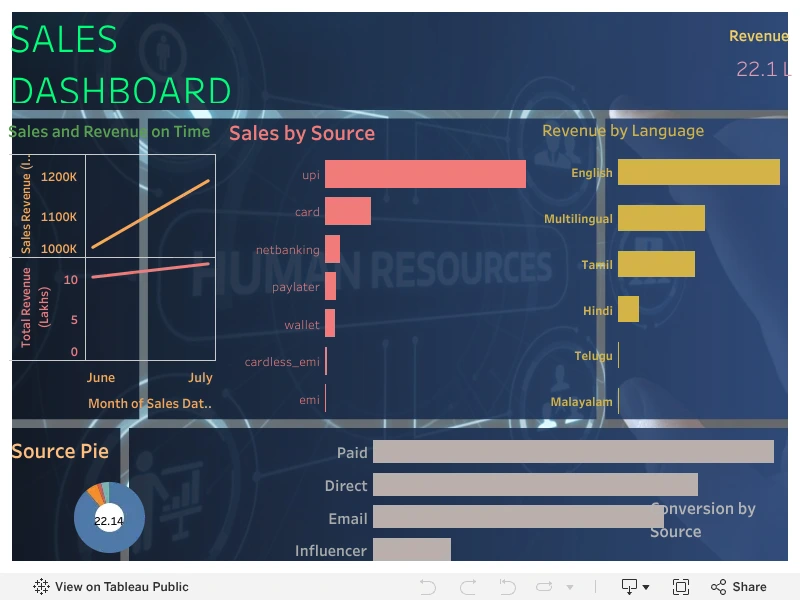
A comprehensive commercial analytics dashboard engineered in Tableau Public to give executive leadership real-time visibility into revenue streams, transaction volumes, and average order values.
Visualizes financial performance trajectories across temporal dimensions with seasonal forecasting, customer cohort analysis, and sales channel effectiveness across digital and direct storefronts.
Analyzes transaction liquidity and customer settlement behavior across modern payment gateways—including UPI, credit/debit card rails, net banking, PayLater, mobile wallets, and cardless EMI financing.
Features
Revenue Trajectory & Sales Velocity
Multi-line time-series trends tracking gross merchandise value, monthly growth rates, and target variance.
Payment Rails & Settlement Analysis
Interactive donut and breakdown charts quantifying transaction volume share across UPI, Cards, Net Banking, and PayLater.
Channel Attribution & Customer Acquisition
Comparative performance matrices dissecting direct vs. paid acquisition channels and geographical performance.
Tech Stack