Electric Vehicle (EV) Market & Distribution Analytics
Interactive Tableau business intelligence dashboard analyzing 150K+ registered electric vehicles, powertrain distribution, and infrastructure readiness.
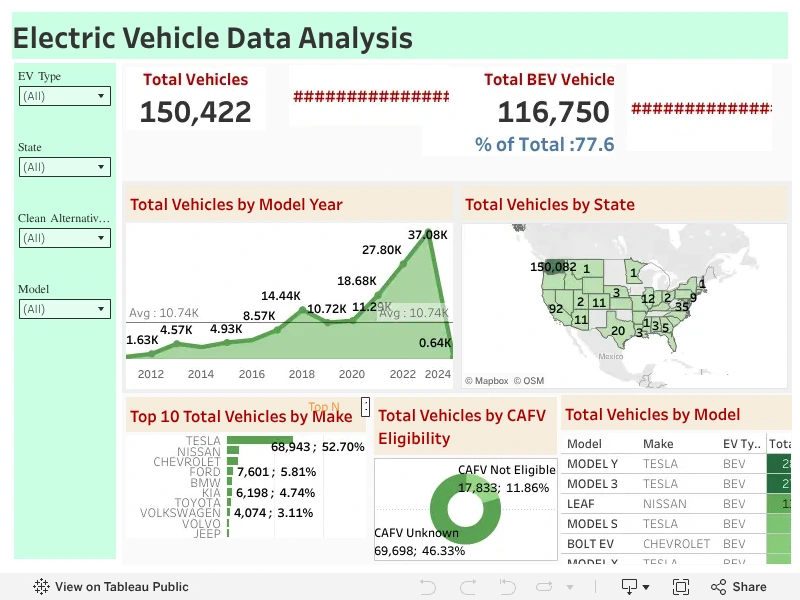
Description
An executive-grade visual intelligence dashboard developed in Tableau Public, tracking the transition to zero-emission mobility across 150,000+ registered vehicles.
Features multi-dimensional segmentation distinguishing Battery Electric Vehicles (BEVs: 77.6% / 116K+ units) from Plug-in Hybrid Electric Vehicles (PHEVs: 22.4%), state-level adoption heatmaps, and year-over-year registration acceleration trends.
Provides automotive stakeholders with granular filtering across top original equipment manufacturers (Tesla, Nissan, Chevrolet, Ford, BMW), vehicle model years, county-level density distributions, and Clean Alternative Fuel Vehicle (CAFV) eligibility statuses.
Features
BEV vs. PHEV Powertrain Breakdown
Dynamic gauges and KPI indicators tracking battery-electric versus hybrid market share and adoption velocities.
Geographic Heatmaps & Density Mapping
Interactive chloropleth spatial visualizer highlighting regional registration concentrations and clean fuel readiness.
Manufacturer Market Share Ranking
Comparative bar and trend charts dissecting top 10 automotive brands by volume and vehicle class.
Tech Stack